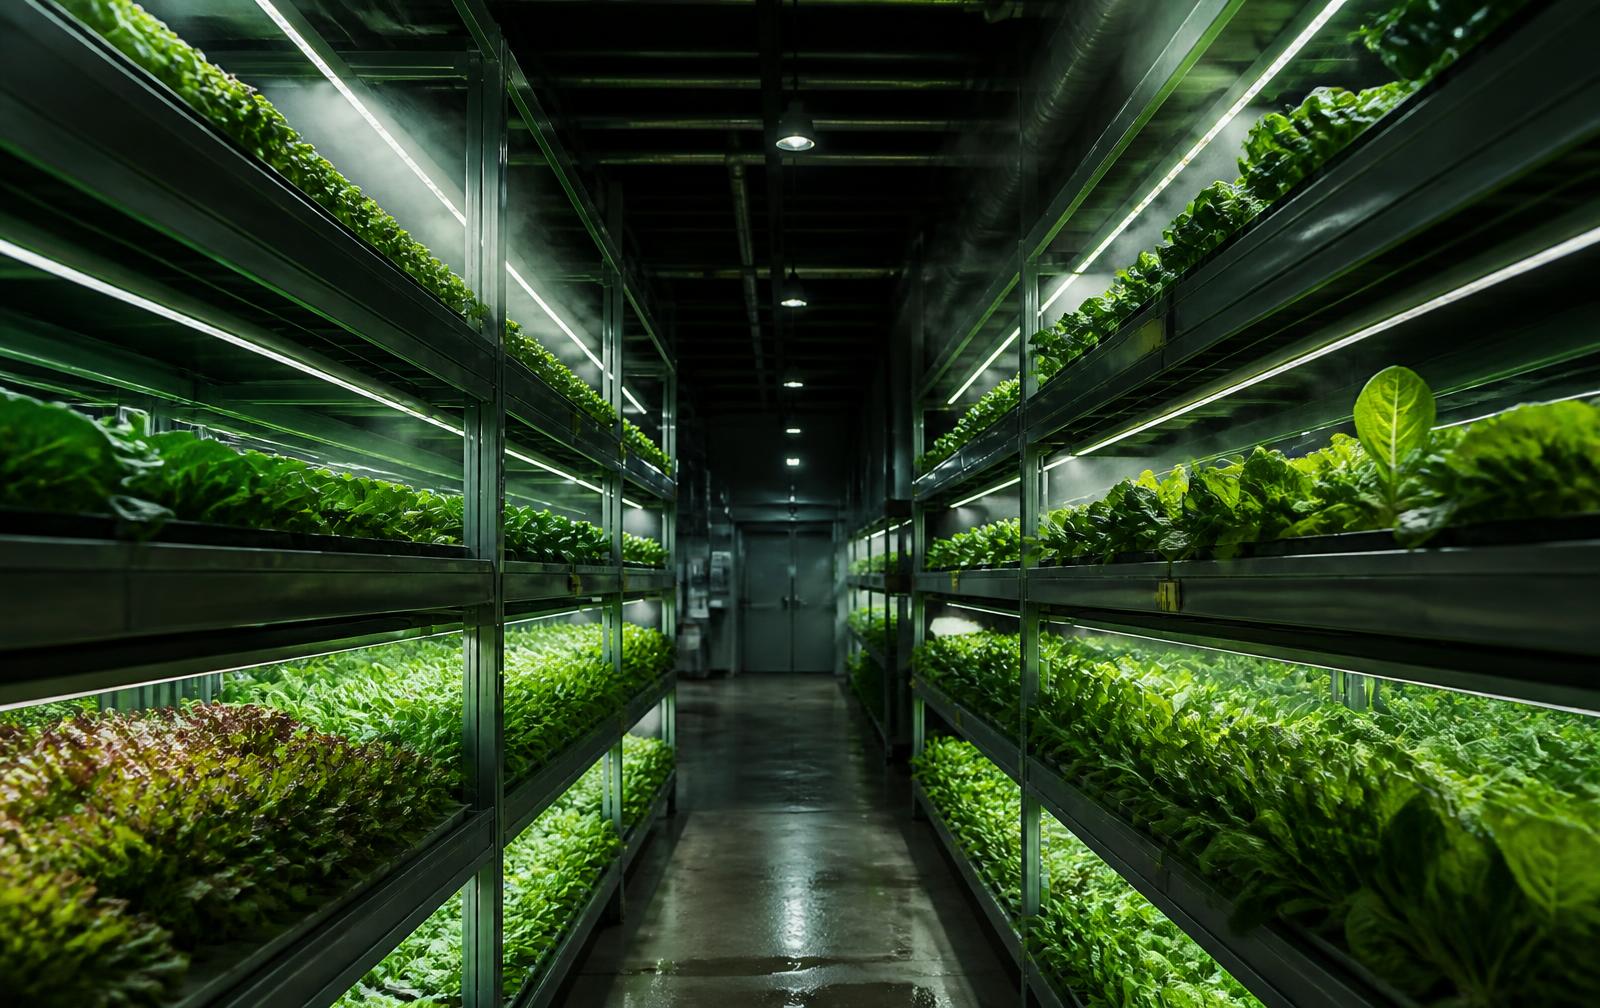
One layer that sees, senses, advises and acts on every zone.
Cropmotive brings vision diagnostics, environment sensing, nutrition guidance and equipment automation together — catching problems days before they show and turning grow data into action across the whole facility.
Command center
Butterhead
96
Basil
94
Romaine
71
Kale
98
Arugula
91
Mint
95
Z-03 · nitrogen trend predicted to show symptoms in ~4 days
24/7
Continuous zone scoring
~4 days
Typical early warning window
0
New cameras required
1 week
Typical time to go live
One platform, four layers
Not a camera app — a complete grow intelligence system.
Vision is only one input. Real control comes from combining what you see with what you measure, what to feed and the equipment that carries it out.
Vision diagnostics
Plant health, growth stage and stress scored continuously from the cameras or phone photos you already use.
Learn moreSenseEnvironment sensing
pH, EC, temperature, humidity, CO₂ and moisture fused into one interpreted, live reading per zone.
Learn moreAdviseNutrition guidance
Deficiencies flagged early with stage-aware, plain-language feeding corrections your team can follow.
Learn moreActAutomation control
Pumps, dosers, fans and lights connected, so a recommendation becomes an action — advisory or autonomous.
Learn moreThe closed loop
Sense, diagnose, advise, act, confirm.
Each layer feeds the next, so an issue is found, corrected and verified — usually before anyone walks the floor.
- 01
Sense
EC drifting low in Zone 03
- 02
Diagnose
Nitrogen uptake risk building
- 03
Advise
Raise N by 12%, dose A+B
- 04
Act
Doser applies the correction
- 05
Confirm
EC recovered, health climbing
Detection to prediction
Not just what is wrong today — what is coming this week.
By combining imagery, sensor trends and feeding history, Cropmotive projects where a zone is heading, so you intervene before yield is lost rather than after.
See predictive intelligenceDay 1 · Zone Z-03 · Romaine
Healthy · 94
Leaf colour, growth rate and sensor readings all in range. No visible symptoms.
Day 4 · Zone Z-03 · Romaine
Watch · 71
Nitrogen deficiency pattern forecast to become visible within four days. Suggested action: raise N for Z-03 and re-check in 24 hours — auto-dosing available.
Grow-cycle learning
Learn what actually worked, cycle over cycle.
Each harvest becomes evidence, so the next cycle starts from what your own operation already proved works best.
Cycle comparison · Romaine · Rack B
Cycle 11
92%
yield vs. plan
EC held steady; no deficiency events
Cycle 12
84%
yield vs. plan
Late N dip caught, partial recovery
Cycle 13
96%
yield vs. plan
Feed adjusted from cycle 12 learning
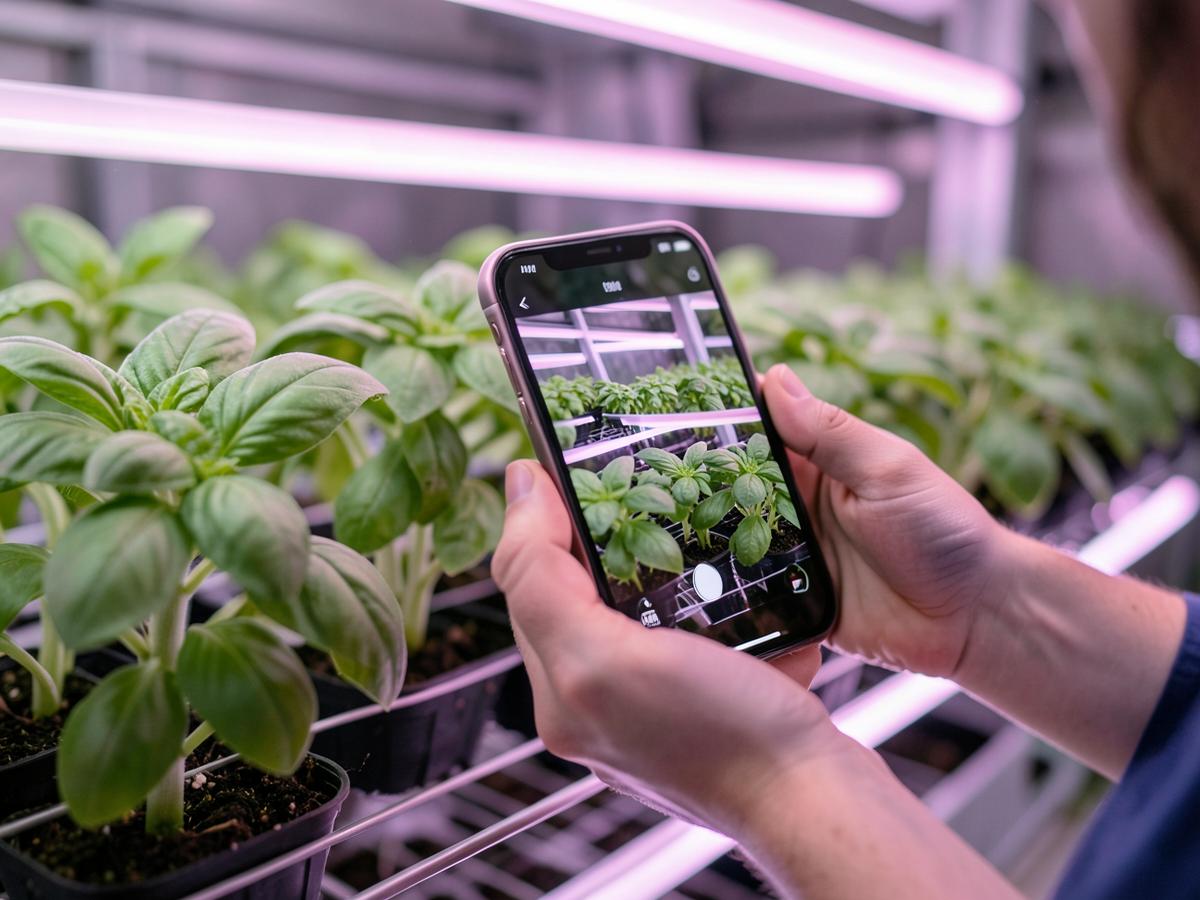
Mobile app & field intelligence
The same intelligence, in the hand of the person on the floor.
Capture a zone, read its score, follow the recommended correction and log the work — offline in the middle of the room, synced the moment you have signal.
Explore the mobile appThe full platform
Every layer, connected.
Twelve capabilities on one shared history — click any of them to see how it works.
Predictive Alerts
See what's coming, not just what's here
Learn moreAnomaly Detection
Spot facility-wide causes early
Learn moreCCTV & Camera Integration
Use the cameras you already own
Learn moreMobile App & Field BI
The same intelligence on the floor
Learn moreMulti-Zone & Multi-Site
Every facility on one screen
Learn moreGrow-Cycle & Yield Analytics
Learn what worked, cycle over cycle
Learn moreReporting & Exports
Reports someone can actually use
Learn moreDeveloper API & Webhooks
Bring grow data into your systems
Learn moreBuilt for real facilities
Made for controlled-environment growers.
Vertical Farms
Multi-level racks hide problems at eye level and above. Cropmotive scores every tier continuously so a struggling tray is found on day one, not at harvest.
Learn moreGreenhouses
Sun, season and ventilation move faster than a manual walk-through. Cropmotive reads the swing and the crop's response together.
Learn moreHydroponics & Aeroponics
In multi-reservoir setups a small drift compounds fast. Cropmotive pairs EC and pH trends with visual plant-stress signals to catch it before it spreads.
Learn moreAgronomy Consultants
Shared history, role-scoped access and cross-client rollups, so you spend visits on judgement instead of on catching up.
Learn moreWhy one connected layer beats point tools
Shared context
The prediction model sees the same history the dashboard shows and the reports export — no data silos between features.
Improves with use
Diagnostics and forecasts sharpen on your own accumulating camera and outcome data, cycle over cycle.
Advisory or autonomous
Run it as a recommendation engine, or let it act on connected pumps, dosers and fans within limits you define — your call, per zone.
Stop reacting to your crop. Start running it with intelligence.
See Cropmotive running on your own zones — cameras, sensors, feeding and equipment, working as one.